Yu-Ting Cheng, PT, BS,1,2 Theresa M. Crytzer, DPT, ATP,1,2 Brad E. Dicianno, MD, MS 1,2,3
1Human Engineering Research Laboratories, Department of Veterans Affairs, Pittsburgh, PA
2Department of Rehabilitation Science and Technology, University of Pittsburgh, Pittsburgh, PA
3Department of Physical Medicine and Rehabilitation, University of Pittsburgh, Pittsburgh, PA
Abstract
A total of 24 subjects with diagnosis of spina bifida, 24 subjects (females, n= 12), ages 17 to 72 years, participated in a one-time arm ergometry exercise stress test. The aim of this study was to investigate the construct and concurrent validity of two rating of perceived exertion scales, the Borg 6-20 Scale and a newly designed WHEEL Scale in adolescents and adults with spina bifida. The results of the study indicated that a modest significant correlation was found between physiological factors, oxygen uptake (VO2) and heart rate (HR), the Borg Scale and the WHEEL Scale during an arm ergometry exercise stress test. Rating of perceived exertion derived from the Borg Scale and from the WHEEL scale were significantly correlated with each other and both scales similar responses to increases in exercise intensity, indicating internal consistency. The WHEEL Scale shows promise as a tool for physical therapists and exercise physiologists to monitor exercise intensity in the spina bifida population. Future studies are needed to validate the WHEEL Scale in a larger cohort of people with spina bifida and to test inter and intra-reliability.
Keywords:
spina bifida, perceived exertion scale, arm ergometry, exercise
Background
According to the Spina Bifida Association reports, there are more than 166,000 individuals currently living with spina bifida (SB) which involves motor and sensory loss, hydrocephalus, tethered cord, Chiari malformation and other conditions (Dicianno et al., 2008). Depending on the level of lesion, people with SB may require a mobility device, ranging from a cane or crutches to a power wheelchair with multiple seat functions (Dicianno et al. 2009). Secondary conditions are prevalent in this population, including cardiovascular disease (Buffart et al. 2008) and metabolic syndrome (Nelson et al., 2007). Regular physical activity has been shown to reduce the risk of these conditions (Stewart et al, 1994; Grange et al., 2002) in people with chronic conditions and disabilities; however, barriers to fitness such as inaccessible exercise equipment, lack of motivation or lack of instruction on exercise performance and safety may reduce or prevent exercise participation (Buffart et al., 2008). Exercise using an adaptive exercise device, such as an arm ergometer was found to improve aerobic fitness in people with spinal cord dysfunction (Widman et al., 2006; Murray et al., 2012). Exercise stress testing is the gold standard for prescribing exercise intensity (ACSM, 2006). Arm ergometry exercise stress testing has been used in studies involving people with spina bifida to determine peak oxygen uptake (V02) and peak heart rate (HR) (Buffart et al., 2008). However, few studies have investigated the validity of a tool for monitoring exercise intensity during an arm ergometer exercise stress test in people with spina bifida.
Rating of Perceive Exertion (RPE)
Rating of perceived exertion derived from the Borg Scale during exercise is a valuable tool for estimating an individual’s physiological demand and regulating exercise intensity (Borg, 1990; Eston et al., 1994; Robertson et al., 2004; ACMS 2006). The Borg 6 – 20 Scale pairs a numeric scale with verbal descriptors ranging from “very, very light” to “very, very hard.” The Borg Scale was validated in able-bodied users under various exercise conditions; and some investigators adopted the scale for use in other populations, including able-bodied adults (Dishman et al., 1994), and people with disabilities (Grange et al., 2002; Goosey-Tolfrey et al., 2010). The verbal descriptors on the Borg scale were developed for an adult population and may not be as useful for children or for individuals who have cognitive impairment (Robertson et al., 2004).
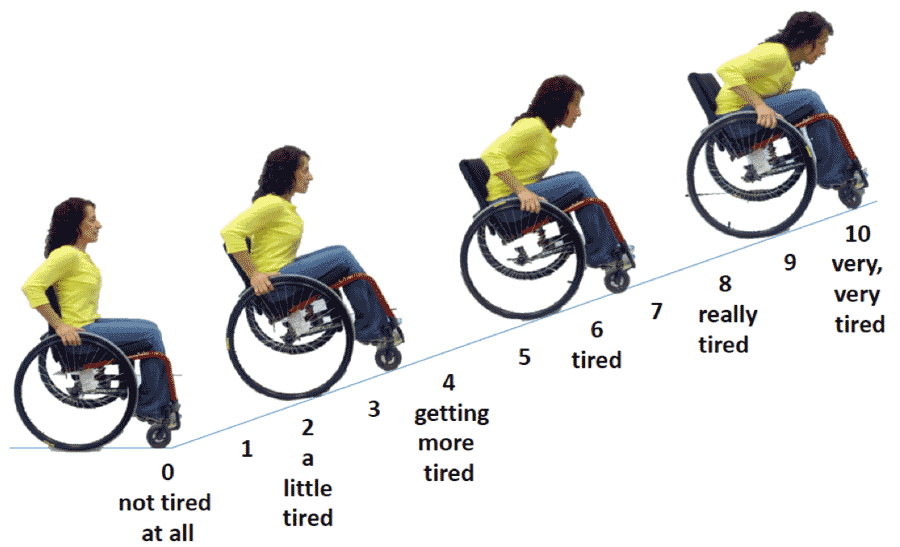 Figure 1. The WHEEL Scale
 The Child OMNI Scale, pairs a numerical response ranging from 0 to 10 with drawings of a person exercising at different intensities and verbal descriptors (Robertson et al., 2000). The Child OMNI Scale has been validated in various populations under various exercise conditions; and it was found to significantly correlate with the Borg Scale (Robertson et al., 2000; Utter et al., 2004; Robertson et al., 2004; Robertson et al., 2006; Nakamura, et al., 2009; Balasekaran et al., 2012; Krause et al., 2012; Higgins et al., 2013). A limited number of studies were found that investigated the use of the Borg and OMNI Scales in people with disabilities (Grange et al., 2002; Higgins et al., 2013). The advantage of the OMNI scale is that those who are unable to read or understand the numeric scale can still choose a level of exertion based on the pictures; can choose a level of exertion based the picture. However, the OMNI Scales, depicts ambulatory individuals exercising on equipment designed for people without disabilities. Thus, individuals with spina bifida who are life-long wheelchair or assistive devices, may not be able to relate their feelings of exertion to this scale. Thus a new rating of perceived exertion scale (WHEEL Scale) was adapted from the Child OMNI Scale (Robertson et al., 2000) and tested during an arm ergometry exercise stress test (Figure 1).
Purpose
The purpose is to investigate the construct and concurrent validity of a newly developed WHEEL Scale and the Borg Scale. The following hypotheses were tested. Hypothesis 1: A significant positive correlation will be seen between RPE obtained from the Borg 6-20 Scale and oxygen uptake (VO2) and heart rate (HR). Hypothesis 2: A significant positive correlation will be seen between RPE obtained from the WHEEL Scale and V02 and HR. Hypothesis 3: A significant positive correlation will be seen between RPE obtained from the Borg Scale and RPE obtained from the WHEEL Scale.
Method
Subject recruitment
This study was approved by the Institutional Review Board of the University of Pittsburgh. This study was part of a larger research project that investigated the pulmonary function among adolescent and adults with spina bifida. Subjects were recruited through flyers and clinician referral from spina bifida clinics in the southwestern Pennsylvania area and the University of Pittsburgh Medical Center (UPMC) Center for Assistive Technology. Participants were screened during a phone interview prior to enrollment based on inclusion/exclusion criteria. Written medical clearance from the subject’s primary care physician was required prior to participation. Inclusion criteria were: (a) having spina bifida but not of the occult type, (b) having scoliosis, (c) inability to ride a standard (two-wheel) bicycle, and (d) age 13-80 years. Exclusion criteria were: (a) having a history of coronary artery disease, coronary bypass surgery, or other cardiopulmonary events, (b) upper extremities injury or loss of shoulder, elbow, and/or wrist range of motion that would prevent performing arm ergometry exercise testing, (c) upper extremity or thoracic surgery in the last six months that would be a contraindication to perform arm ergometry exercise testing, and (d) any other medical condition for which the subject’s primary care physician determined was a contraindication to arm ergometry exercise testing. Prior to graded exercise stress testing, participants, and parents if the child was a minor, were required to achieve a score of 8 out of 10 on the MacArthur Competence tool (Grisso et al., 1997) to confirm their ability to understand the study before signing the consent forms. Parental consent and childhood assent were obtained for subjects who were under 18.
Experimental protocol
Participants performed a symptom limited exercise stress test in an exercise test laboratory using an electronically braked arm ergometer (Saratoga Silver I Rand-Scot Inc., Colorado, U.S.A.). The test was administered by a trained exercise physiologist. The majority of participants (79%) sat in their own manual wheelchair for testing. One participant sat in a power wheelchair and four participants sat in a standard office chair. A latex free mask (Hans-Rudolph Inc., Kansas, U.S.A.) and a Polar heart rate monitor band (Polar Electro, Kempele, Finland) were placed on participant’s face and xiphoid process respectively. The mask was connected to a metabolic cart (Moxus, AEI Technologies, Inc., Pennsylvania, U.S.A.) that recorded subject’s HR, VO2, and carbon dioxide output (VCO2). After a brief warm up at 10 Watts, the exercise test began and participants cranked at 70 revolutions per minute (RPM) throughout the test while the work rate increased by 10 Watts each minute until the subject was exhausted. A metronome and verbal encouragement were provided to help subjects maintain the 70RPM pace throughout the test. The participants were asked to state their level of exertion on both Borg and the WHEEL Scale each minute until the end of the test at the end of each workload until the end of the test.
Data analysis
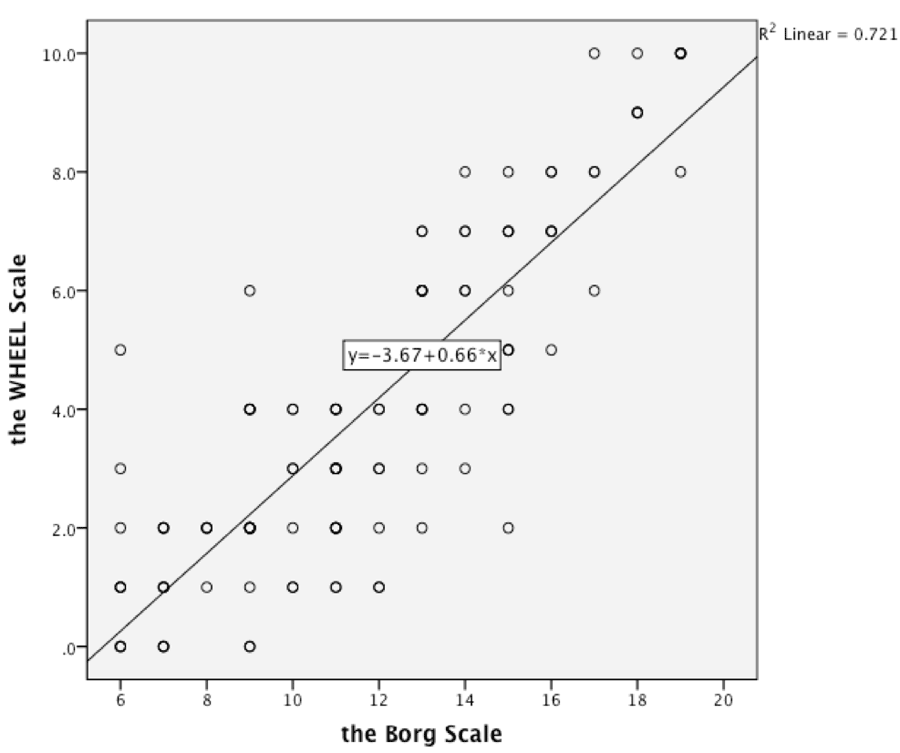 Figure 2. Scatter plot of the Borg Scale versus the WHEEL Scale
 Statistical analyses were performed using IBM SPSS Statistics Premium Edition version 21.0 for Windows. Descriptive statistics for socio-demographic data and physiological data were presented as mean ± standard deviation (SD) for variables that were continuous and as a count (percentage) for variables that were categorical. Evidence for the concurrent validity of the WHEEL Scale was determined using correlation analysis (r2). Kendall’s tau correlation analysis was used to determine whether physiologic variables (VO2 and HR) increased linearly and positively as workload increased during the test. The physiological variables were collected every 20 seconds and the values were averaged at 20 seconds and 40 seconds of each exercise minute. When a physiological variable was not normally distributed, a logarithmic function was applied to normalize the data. A scatter plot of the WHEEL Scale versus the Borg Scale was constructed to show the dispersion of the data points for each subject around the best fit line.. The level of statistic significance was set at p ≤ 0.05.
Results
Twenty-four subjects (females, n=12) participated in this study. Demographic information and descriptive characteristics for all subjects are presented in Table 1 and Table 2. The functional level of lesion was recorded from participants’ medical record. A total of 15 subjects (62.5%) had a thoracic level lesion, eight subjects (33.3%) had a lumbar level lesion, and one subject (4.2%) had a sacral level lesion. The number of people who were primary manual wheelchair users was 66.7%. Body mass index (BMI) was calculated based on each participant’s length of arm span rather than height. One subjects HR data was unable to be used in the calculations because his HR failed to record during exercise test due to equipment error.
Variables |
N (%) |
|
|---|---|---|
Gender |
Male |
12 (50%) |
Female |
12 (50%) |
|
Race |
White |
21 (85.7%) |
Black or African-American |
2 (8.3%) |
|
Other |
1 (4.2%) |
|
Level of lesion |
Thoracic |
15 (62.5%) |
Lumbar |
8 (33.3%) |
|
Sacral |
1 (4.2%) |
|
Primary assistive technology for mobility |
Manual wheelchair |
16 (66.6%) |
Power wheelchair |
2(8.3%) |
|
Crutches/Cane/Walker |
4 (16.6%) |
|
None |
2 (8.3) |
|
Variables |
Mean ± SD |
|---|---|
Age (years) |
32.71 ± 13.11 |
Weight (kg) |
64.41 ± 18.30 |
Length of arm span (m) |
1.64 ± 0.10 |
BMI based on arm span (kg.m-2) |
24.23 ± 7.81 |
Oxygen uptake (VO2) (l.min-1) |
1.24 ± 0.63 |
Heart Rate* (beats.min-1) |
148.13 ± 28.08 |
For hypothesis 1, our results showed a significant positive relation between VO2 and the Borg Scale (r2= 0.23, p< 0.0001), and between HR and the Borg Scale (r2= 0.21, p< 0.002). For hypothesis 2, our results showed significant positive relation between VO2 and the WHEEL Scale (r2= 0.29, p< 0.001), and between HR and the WHEEL Scale (r2= 0.22, p< 0.0001) (Table 3). For hypothesis 3, our results showed a significant positive relation between the Borg Scale and the WHEEL Scale (r2= 0.72, p< 0.0001) (Table 3 and Figure 2).
Discussion
In this study, we tested the concurrent and construct validity of a newly developed WHEEL Scale based on a one-time symptom limited arm ergometry exercise stress test. Although there was small sample size in this study, the experimental protocol and testing procedure were standardized to improve reliability (Robertson et al., 2005; Krause et al., 2012). For hypothesis 1 and hypothesis 2, the results showed modest positive correlations between physiological variables and both RPE scales. However, the correlation coefficients were small in comparison to previous studies that used the OMNI Scale in able-bodied individuals (Nakamura et al, 2009; Balasekaran et al, 2012; Krause et al, 2012). One possible explanation would be the small sample size in this study. Another explanation may be due to variability amongst our participants in their exercise tolerance, which may have affected the results of the exercise testing. For example, the number of self-reported hours of exercise per week varied amongst participants from 0 hours to 8 hours. The findings of Buffart et al (2008) support this theory, in that individuals with SB who had lower levels of daily physical activity had significantly lower levels of aerobic fitness. Also, during the exercise stress test, participants used their upper extremities to pedal arm ergometer, which was performed by the small muscles of upper body when compared to large muscles of lower body that are used for leg ergometry exercise testing. It may be that participants did not the reach the levels of V02 that would be achievable with leg ergometry.
Criterion variables |
Borg Scale |
WHEEL Scale |
||
r2 |
p |
r2 |
p |
|
Oxygen uptake (VO2) (l.min-1) |
0.23 |
0.0001 |
0.29 |
0.001 |
Heart Rate (beats.min-1) |
0.21 |
0.002 |
0.22 |
0.0001 |
Borg Scale |
– |
0.72 |
0.0001 |
|
The relationship between the Borg Scale and the WHEEL Scale was highly correlated, which is consistent with findings in other studies that used the OMNI Scale (Robertson et al., 2004) and indicates high internal consistency, meaning they measured the same construct. The WHEEL Scale has potential for use by physical therapists or exercise physiologists to monitor exercise intensity in people with spina bifida during therapeutic exercise. The benefit of using WHEEL Scale is easy to learn and use without interrupting the exercise flow. Also, the WHEEL Scale would be a low cost method of monitoring exercise intensity in a clinical setting if future studies in larger populations confirm its validity.
Conclusion
This study collected physiological data among people with spina bifida during a one-time arm ergometry exercise stress test. Significant positive correlations were found between VO2 and the Borg Scale and Wheel Scale; between HR and the Borg Scale and the WHEEL Scale; and between the Borg Scale and the WHEEL Scale We found internal consistency with the Borg and WHEEL Scale. The WHEEL Scale may be as a useful tool for clinicians prescribing and regulating exercise intensity for people with spina bifida with future studies that test validity and reliability in a larger cohort of individuals with spina bifida who are wheelchair users.
References
American College of Sports Medicine. (2006). ACSM’s Guidelines For Exercise Testing and Prescription- seventh edition. Lippincott Williams and Wilkins.
Balasekaran, G., Loh, M. K., Govindaswamy, V. V., & Robertson, R. J. (2012). OMNI Scale of Perceived Exertion: mixed gender and race validation for Singapore children during cycle exercise. European journal of applied physiology, 112(10), 3533–46. doi:10.1007/s00421-012-2334-8
Borg, G. (1990). Psychophysical scaling with applications in physical work and the perception of exertion. Scandinavian Journal of Work, Environment & Health, 16 Sup, 55–58. doi:10.5271/sjweh.1815
Buffart, L. M., Roebroeck, M. E., Rol, M., Stam, H. J., & van den Berg-Emons, R. J. G. (2008). Triad of physical activity, aerobic fitness and obesity in adolescents and young adults with myelomeningocele. Journal of rehabilitation medicine : official journal of the UEMS European Board of Physical and Rehabilitation Medicine, 40(1), 70–5. doi:10.2340/16501977-0135
Buffart, L. M., van den Berg-Emons, R. J., Burdorf, A., Janssen, W. G., Stam, H. J., & Roebroeck, M. E. (2008). Cardiovascular disease risk factors and the relationships with physical activity, aerobic fitness, and body fat in adolescents and young adults with myelomeningocele. Archives of physical medicine and rehabilitation, 89(11), 2167–73. doi:10.1016/j.apmr.2008.04.015
Crytzer, T. M., Dicianno, B. E., & Kapoor, R. (2013). Physical Activity, Exercise, and Health-related Measures of Fitness in Adults With Spina Bifida: A Review of the Literature. PM & R : the journal of injury, function, and rehabilitation, 5(12), 1051–62. doi:10.1016/j.pmrj.2013.06.010
Dicianno, B. E., Gaines, A., Collins, D. M., & Lee, S. (2009). Mobility, assistive technology use, and social integration among adults with spina bifida. American journal of physical medicine & rehabilitation / Association of Academic Physiatrists, 88(7), 533–41. doi:10.1097/PHM.0b013e3181aa41d4
Dicianno, B. E., Kurowski, B. G., Yang, J. M. J., Chancellor, M. B., Bejjani, G. K., Fairman, A. D., … Sotirake, J. (2008). Rehabilitation and medical management of the adult with spina bifida. American journal of physical medicine & rehabilitation / Association of Academic Physiatrists, 87(12), 1027–50. doi:10.1097/PHM.0b013e31818de070
Dishman, R. K. (1994). Prescribing exercise intensity for healthy adults using perceived exertion. Medicine and science in sports and exercise, 26(9), 1087–94.
Dosa, N. P., Foley, J. T., Eckrich, M., Woodall-Ruff, D., & Liptak, G. S. (2009). Obesity across the lifespan among persons with spina bifida. Disability and rehabilitation, 31(11), 914–20. doi:10.1080/09638280802356476
Eston, R. G., Lamb, K. L., Bain, A., Williams, a M., & Williams, J. G. (1994). Validity of a perceived exertion scale for children: a pilot study. Perceptual and motor skills, 78(2), 691–7. Retrieved from http://www.ncbi.nlm.nih.gov/pubmed/8022701
Goosey-Tolfrey, V., Lenton, J., Goddard, J., Oldfield, V., Tolfrey, K., & Eston, R. (2010). Regulating intensity using perceived exertion in spinal cord-injured participants. Medicine and science in sports and exercise, 42(3), 608–13. doi:10.1249/MSS.0b013e3181b72cbc
Grange, C. C., Bougenot, M. P., Groslambert, A., Tordi, N., & Rouillon, J. D. (2002). Perceived exertion and rehabilitation with wheelchair ergometer: comparison between patients with spinal cord injury and healthy subjects. Spinal cord, 40(10), 513–8. doi:10.1038/sj.sc.3101353
Grisso, T., Appelbaum, P. S., & Hill-Fotouhi, C. (1997). The MacCAT-T: a clinical tool to assess patients’ capacities to make treatment decisions. Psychiatric services (Washington, D.C.), 48(11), 1415–9. Retrieved from http://www.ncbi.nlm.nih.gov/pubmed/9355168
Higgins, L. W., Robertson, R. J., Kelsey, S. F., Olson, M. B., Hoffman, L. a, Rebovich, P. J., … Orenstein, D. M. (2013). Exercise intensity self-regulation using the OMNI scale in children with cystic fibrosis. Pediatric pulmonology, 48(5), 497–505. doi:10.1002/ppul.22639
Krause, M. P., Goss, F. L., Robertson, R. J., Kim, K., Elsangedy, H. M., Krinski, K., & Da Silva, S. G. (2012). Concurrent Validity of An OMNI Rating of Perceived Exertion Scale for Bench Stepping Exercise. Journal of Strength and Conditioning Research, 26(2), 506–512.
Murray, D., Meldrum, D., Moloney, R., Campion, A., Horgan, F., & Hardiman, O. (2012). The effects of a home-based arm ergometry exercise programme on physical fitness, fatigue and activity in polio survivors: protocol for a randomised controlled trial. BMC neurology, 12(1), 157. doi:10.1186/1471-2377-12-157
Nakamura, Fabio Y.; Perandini, Luiz A.; Okuno, N. M. (2009). Construct and concurrent validation of omni– kayak rating of perceived exertion scale. Perceptual and motor skills, 108, 744–758. doi:10.2466/PMS.108.3.744-758
Nelson, M. D., Widman, L. M., Abresch, R. T., Stanhope, K., Havel, P. J., Styne, D. M., & McDonald, C. M. (2007). Metabolic syndrome in adolescents with spinal cord dysfunction. The journal of spinal cord medicine, 30 Suppl 1(7), S127–39. Retrieved from http://www.pubmedcentral.nih.gov/articlerender.fcgi?artid=2031992&tool=pmcentrez&rendertype=abstract
Rimmer, J. H., Schiller, W., & Chen, M.-D. (2012). Effects of disability-associated low energy expenditure deconditioning syndrome. Exercise and sport sciences reviews, 40(1), 22–9. doi:10.1097/JES.0b013e31823b8b82
Robertson, R. J., Goss, F. L., Aaron, D. J., Tessmer, K. a., Gairola, A., Ghigiarelli, J. J., … Weary, K. a. (2006). Observation of Perceived Exertion in Children Using the OMNI Pictorial Scale. Medicine & Science in Sports & Exercise, 38(1), 158–166. doi:10.1249/01.mss.0000190595.03402.66
Robertson, R. J., Goss, F. L., Boer, N. F., Peoples, J. a., Foreman, A. J., Dabayebeh, I. M., … Thompkins, T. (2000). Children’s OMNI Scale of Perceived Exertion: mixed gender and race validation. Medicine & Science in Sports & Exercise, 32(2), 452–8. doi:10.1097/00005768-200002000-00029
Robertson, R. J., Goss, F. L., Dube, J., Rutkowski, J., Dupain, M., Brennan, C., & Andreacci, J. (2004). Validation of the adult OMNI scale of perceived exertion for cycle ergometer exercise. Medicine and science in sports and exercise, 36(1), 102–8. doi:10.1249/01.MSS.0000106169.35222.8B
Schoenmakers, M., Uiterwaal, C., Gulmans, V., Gooskens, R., & Helders, P. (2005). Determinants of functional independence and quality of life in children with <B>spina bifida</B>. Clinical Rehabilitation, 19(6), 677–685. doi:10.1191/0269215505cr865oa
Short, K. R., & Frimberger, D. (2012). A review of the potential for cardiometabolic dysfunction in youth with spina bifida and the role for physical activity and structured exercise. International journal of pediatrics, 2012, 1–11. doi:10.1155/2012/541363
Spina Bifida Association. (n.d.). Retrieved November 01, 2014, from http://www.spinabifidaassociation.org/site/c.evKRI7OXIoJ8H/b.8277225/k.5A79/What_is_Spina_Bifida.htm
Stepanczuk, B. C., Dicianno, B. E., & Webb, T. S. (2013). Young Adults with Spina Bifida May Have Higher Occurrence of Prehypertension and Hypertension. American journal of physical medicine & rehabilitation / Association of Academic Physiatrists, 92(11), 1–7. doi:10.1097/PHM.0b013e3182a92b03
Stewart, A. L., Hays, R. D., Wells, K. B., Rogers, W. H., Spritzer, K. L., & Greenfirld, S. (1994). Long-term functioning and well-being outcomes associated with physical activity and exercise in patients with chronic conditions in the medical outcomes study. Journal of Clinical Epidemiology, 47(7), 719–30.
Utter, A. C., Robertson, R. J., Green, J. M., Suminski, R. R., Mcanulty, S. R., & Nieman, and D. C. (2004). Validation of the Adult OMNI Scale of Perceived Exertion for Walking/Running Exercise. Medicine & Science in Sports & Exercise, 36(10), 1776–1780. doi:10.1249/01.MSS.0000142310.97274.94
Widman, L. M., McDonald, C. M., & Abresch, R. T. (2006). Effectiveness of an upper extremity exercise device integrated with computer gaming for aerobic training in adolescents with spinal cord dysfunction. The journal of spinal cord medicine, 29(4), 363–70. Retrieved from http://www.pubmedcentral.nih.gov/articlerender.fcgi?artid=1864855&tool=pmcentrez&rendertype=abstract
Acknowledgement
The study was funded by the Spina Bifida Association and Ashley Rose Foundation. We thank all participants, their families, and staff at the laboratories where the testing was conducted involved in this study without whom this study would not have been possible.
Audio Version PDF Version